New MultiHub Reports: Google Ads Change History + Top Cities for New Website Visitors
At Repli, we’re always working to give you more clarity, insight, and control over your marketing data. That’s why we’re excited to announce two new reports now available in your Cross-Channel reporting dashboard in MultiHub.
These updates are designed to make your performance data even more actionable—helping you stay informed, make faster decisions, and get the most from your campaigns. Let’s take a closer look 👇
Google Ads Change History Report
Understand exactly what’s happening in your Google Ads account—without leaving MultiHub.
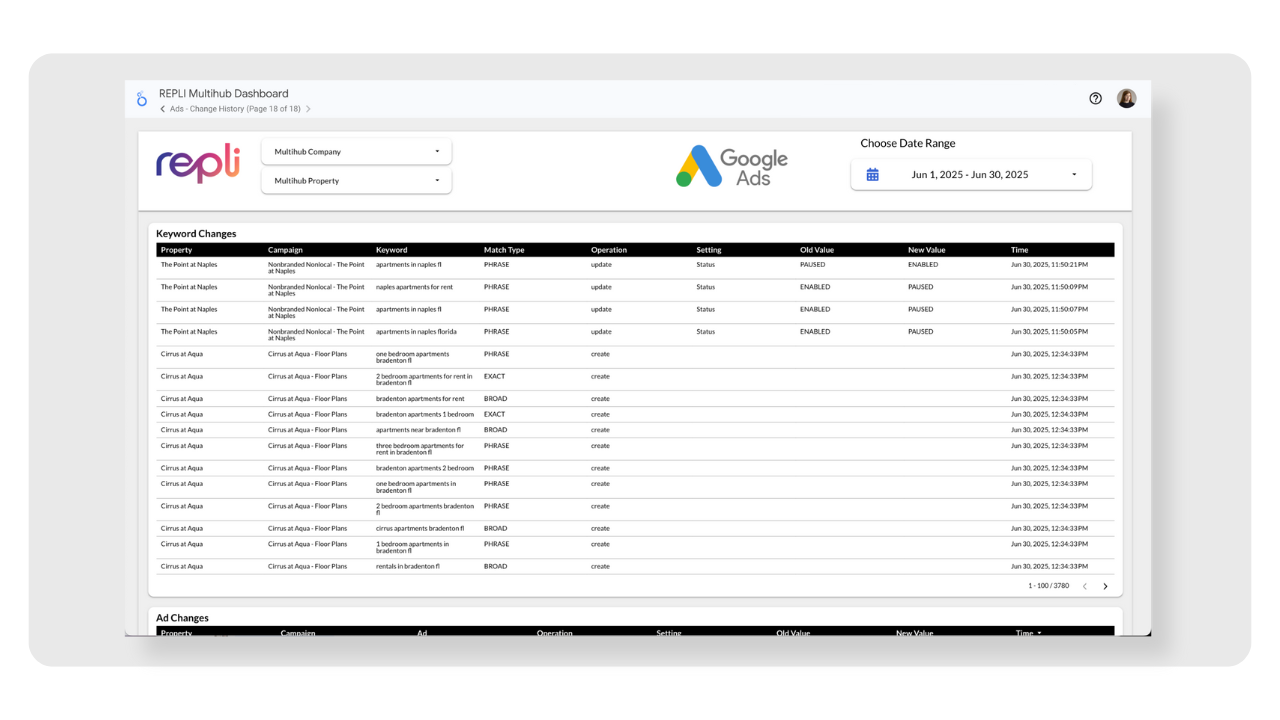
Whether you manage your own Google Ads or work with a partner agency, it’s critical to know what changes are being made, when they happen, and how they could be impacting your results. Our new Google Ads Change History Report gives you exactly that.
🔧 What it includes:
This report pulls in detailed logs from your connected Google Ads account, showing changes made to:
- Campaigns
- Ad Groups
- Ads
- Keywords
Each table is filterable by Company, Property, and Date Range, making it easy to find the data that matters most to you.
✅ Why it matters:
- Easily audit performance changes
- Identify the cause of sudden fluctuations in traffic or conversions
- Keep internal teams and external partners accountable
- Reduce time spent digging through Google Ads manually
💡
Heads up: Google’s change data can be delayed by up to
24–36 hours, so if you’re checking today’s changes, give it some time to populate.
Top 3 Cities for New Users (from Google Analytics)
Get a snapshot of where your newest prospects are coming from.
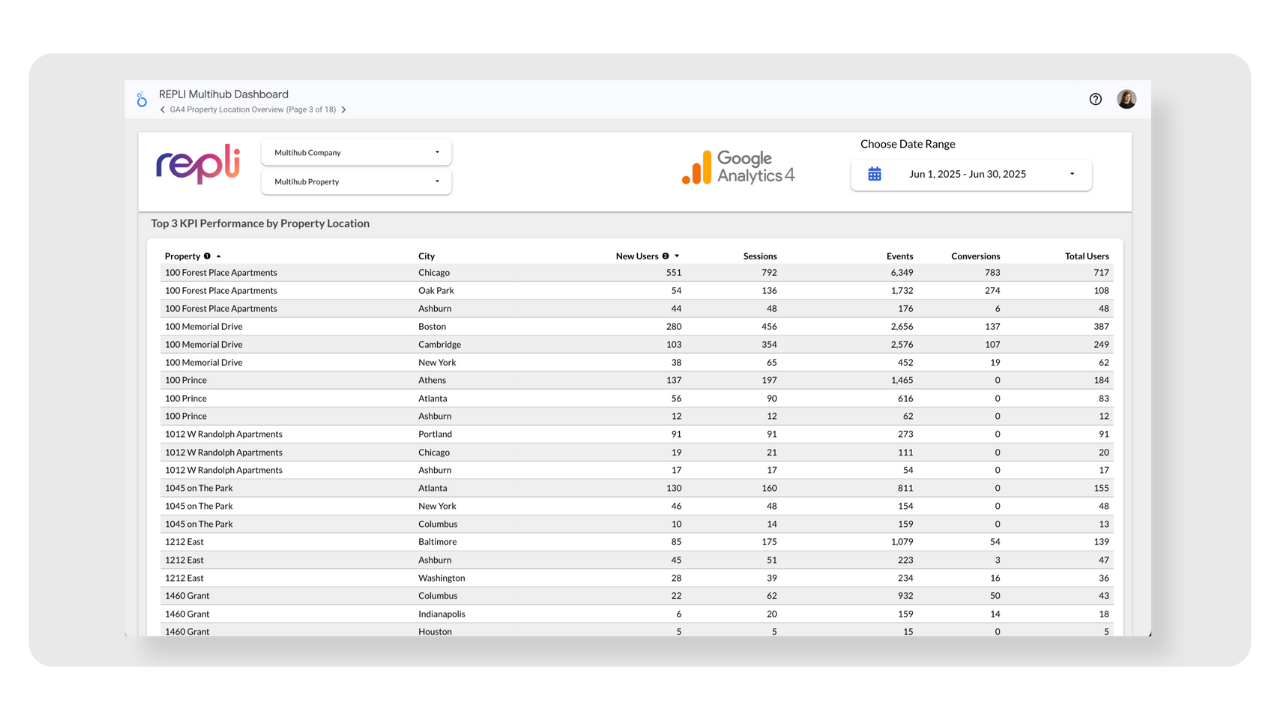
Knowing who’s visiting your website is valuable—but knowing where they’re coming from is even better. This new report surfaces the top 3 cities driving new users for each of your properties, using data from Google Analytics.
🌍 What it includes:
- Your top 3 cities by "New Users" (first-time visitors)
- A breakdown of visitor count per city
- Property-specific views
✅ Why it matters:
- Identify emerging interest in new markets
- Tailor messaging or promotions by region
- Spot trends in geographic engagement
- Inform geo-targeted ad strategies or local events
This is especially useful for marketing teams looking to drive regional impact or for operators exploring expansion into high-interest areas.
How to Access These Reports
Both reports are now live in the Cross-Channel Report found in the PerformanceHub. Just log in, select the the cross-channel report, and start uncovering insights.
Final Thoughts
These reports are part of our ongoing mission to simplify complex marketing data and give multifamily marketers the tools they need to act faster and smarter. Whether you're fine-tuning campaigns or analyzing trends across your portfolio, MultiHub keeps everything connected, visible, and easy to navigate.
Have questions or feedback? Reach out to your Customer Success Representative or drop us a note—we’re here to help.
📊 Log in to MultiHub today and check out the new reports!
Repli Apartment Marketing Blog
Subscribe to our Newsletter & Blogs
Blog Post Subscribe Form
Share Our Post!
Apartment Marketing Blog