
2026 SEARCH AD BENCHMARK REPORT
The Industry Paid More. Repli Delivered More.
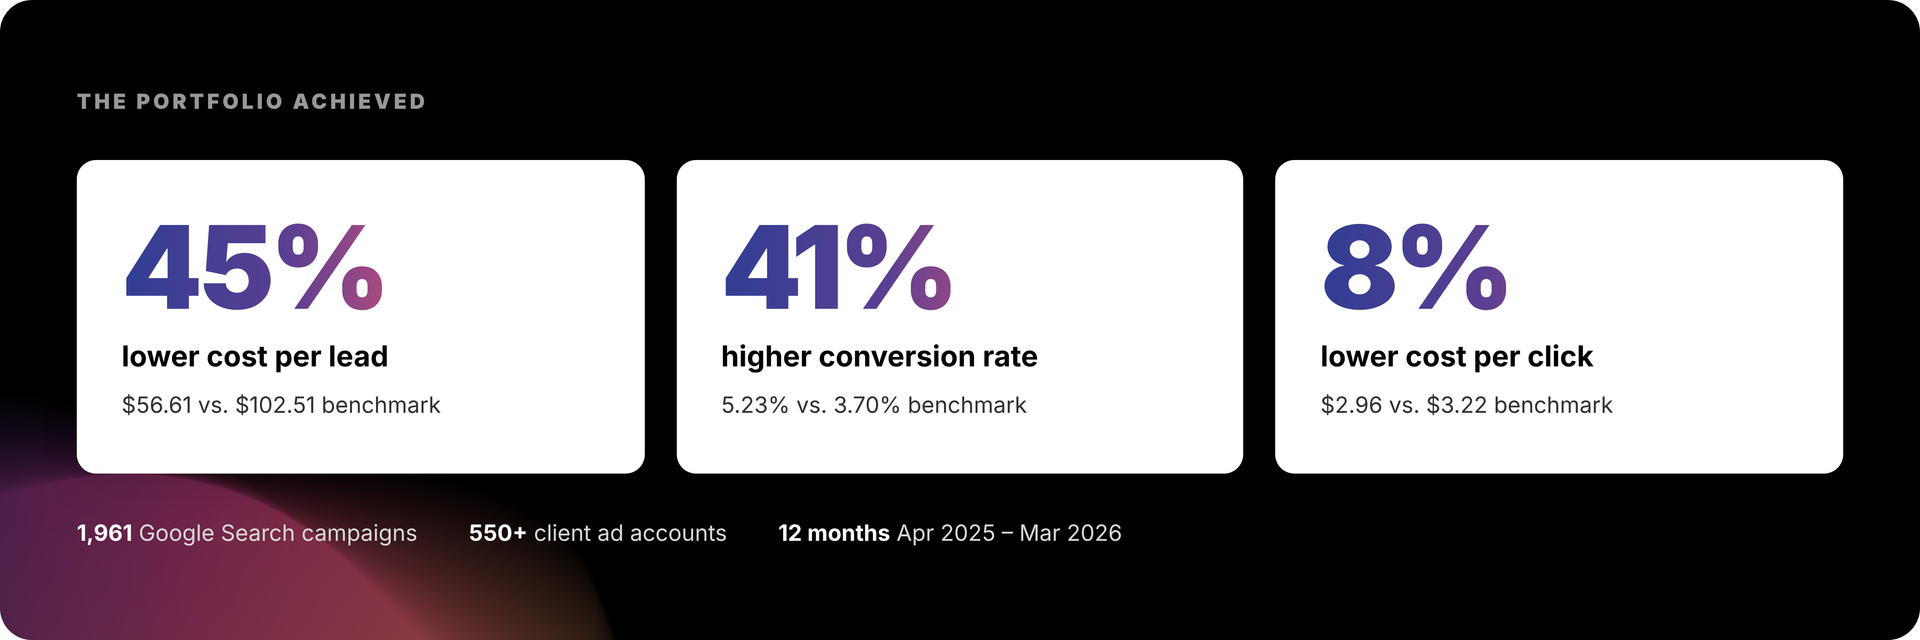
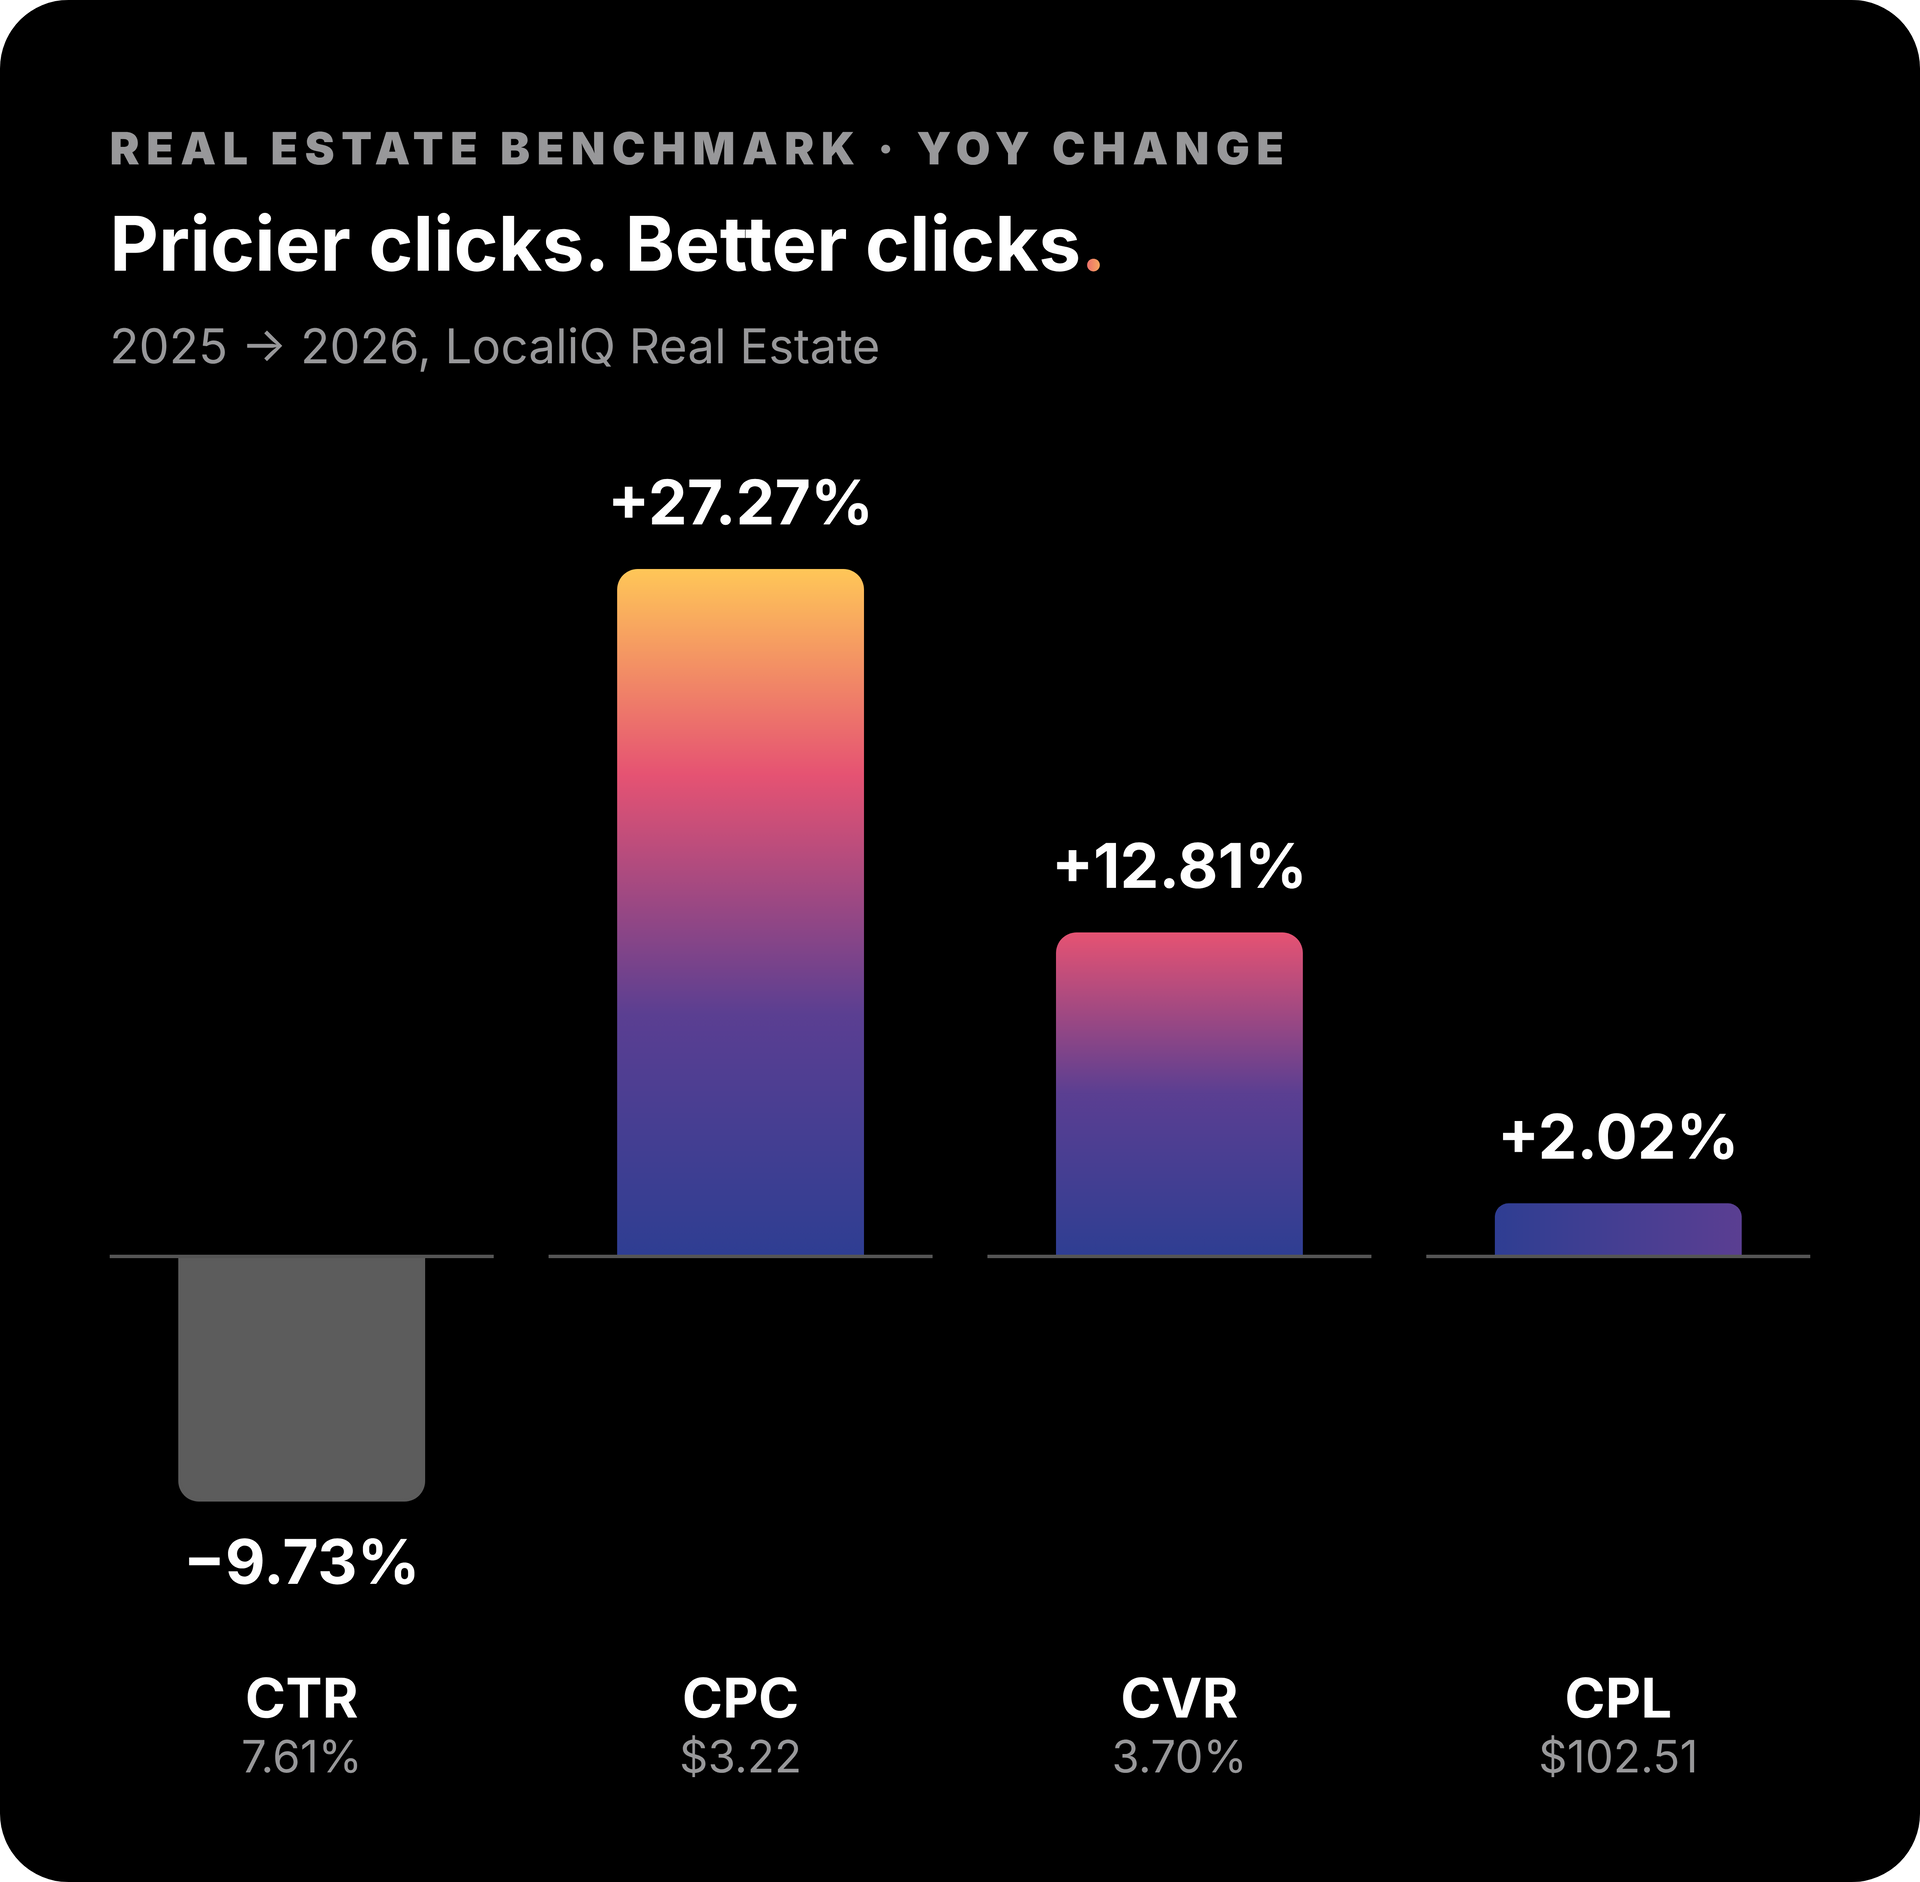
Real estate search advertising is getting more expensive. Real estate cost per click jumped 27% in a single year. Repli-managed Google Search campaigns delivered leads at 45% below the industry benchmark. We analyzed 1,961 campaigns across 550+ client ad accounts to uncover what the numbers reveal about better paid search performance.
the overview.
Pricier clicks. Better results.
What does strong search performance look like in a year when advertising costs are climbing? We compared 12 months of Repli-managed Google Search campaign data against LocaliQ's 2026 real estate benchmarks to find out. The results reveal where Repli campaigns outperform the industry and what the numbers tell us about the opportunities ahead.
We compared 1,961 active Repli-managed Google Search campaigns across 550+ client ad accounts with LocaliQ's 2026 Real Estate benchmarks. Same 12 months for both: April 2025 through March 2026.
the solutions.
Repli's search strategy is built around 3 core pillars.
Better results don't come from clicks alone. They come from matching campaign structure, ad messaging, and landing-page experiences to renter intent. The report breaks down three core strategies behind Repli's approach—and practical ways multifamily marketers can apply these principles to their own campaigns.
Explore the full benchmarks and optimization recommendations in the report.
the results.
Repli beat the real estate benchmark on all four metrics.
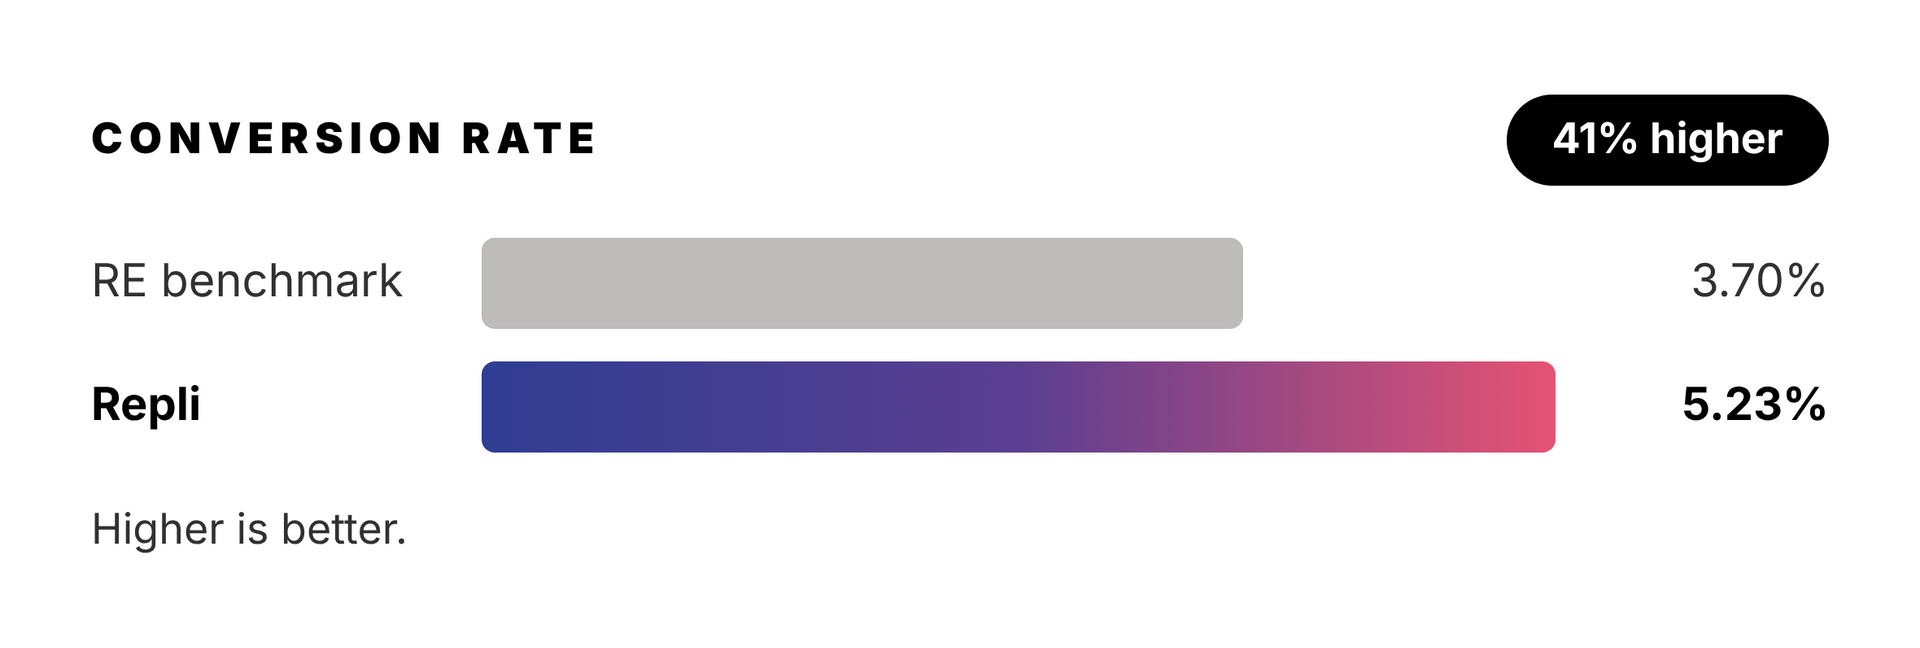
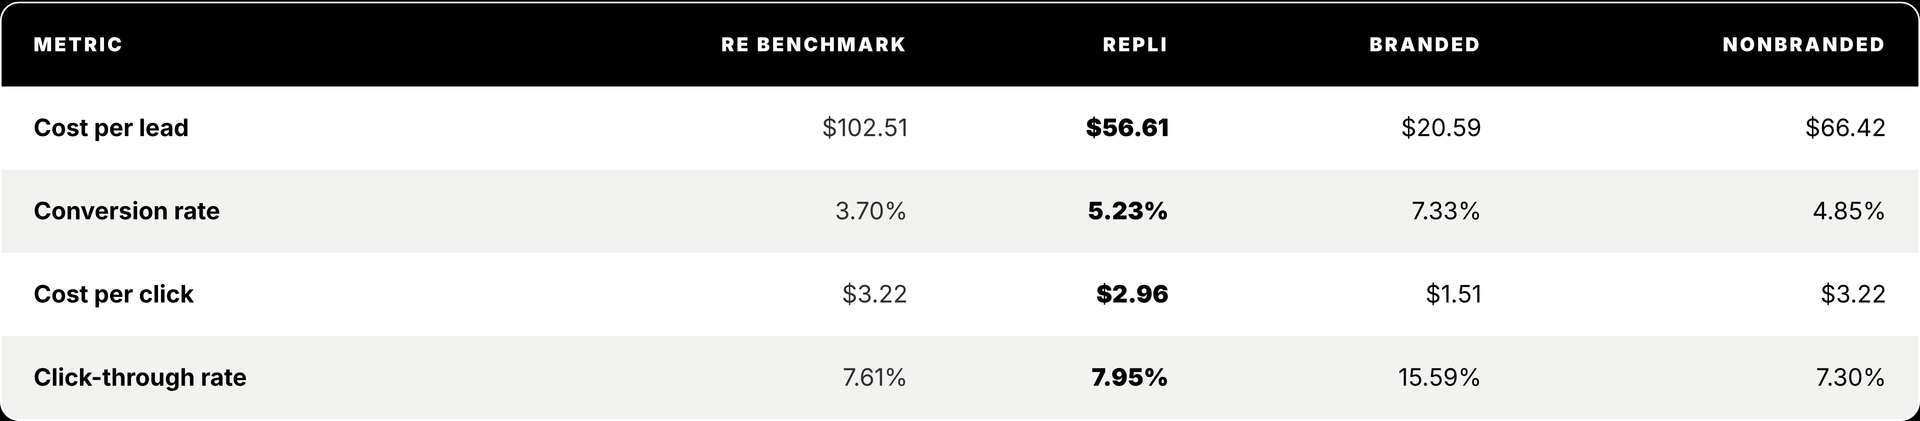
Repli-managed campaigns outperformed the real estate benchmark across all four key search metrics: cost per lead, conversion rate, cost per click, and click-through rate.
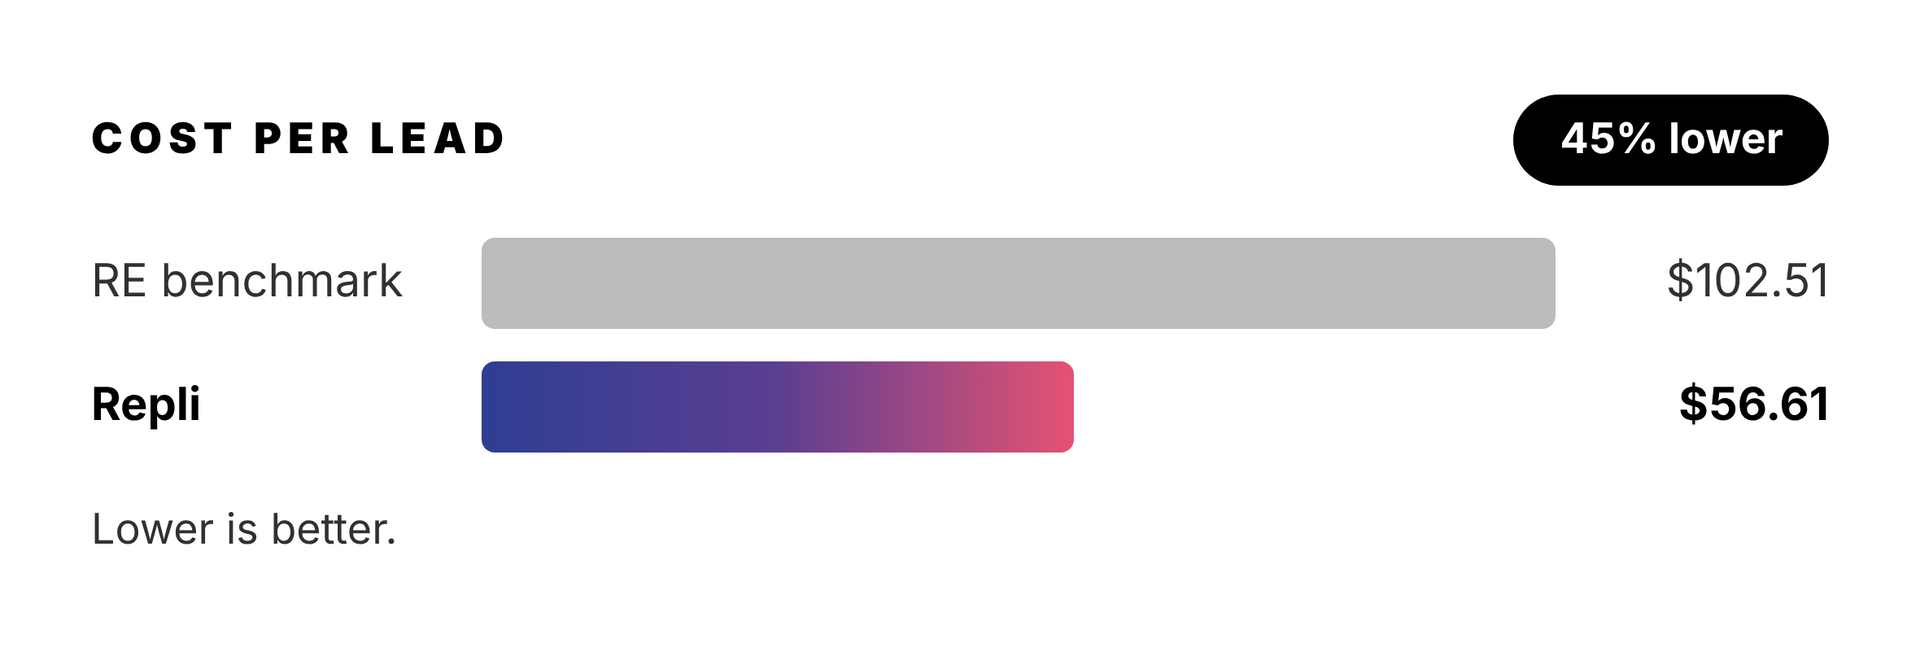
The biggest difference? Cost per lead. Repli campaigns averaged $56.61 per lead, compared with the industry's $102.51 benchmark. And this wasn't limited to renters already familiar with a community. Nonbranded campaigns generated leads at $66.42—still 35% below the industry benchmark.
The takeaway: campaign performance isn't just about getting cheaper clicks. It's about attracting the right traffic and converting more of it into leads.
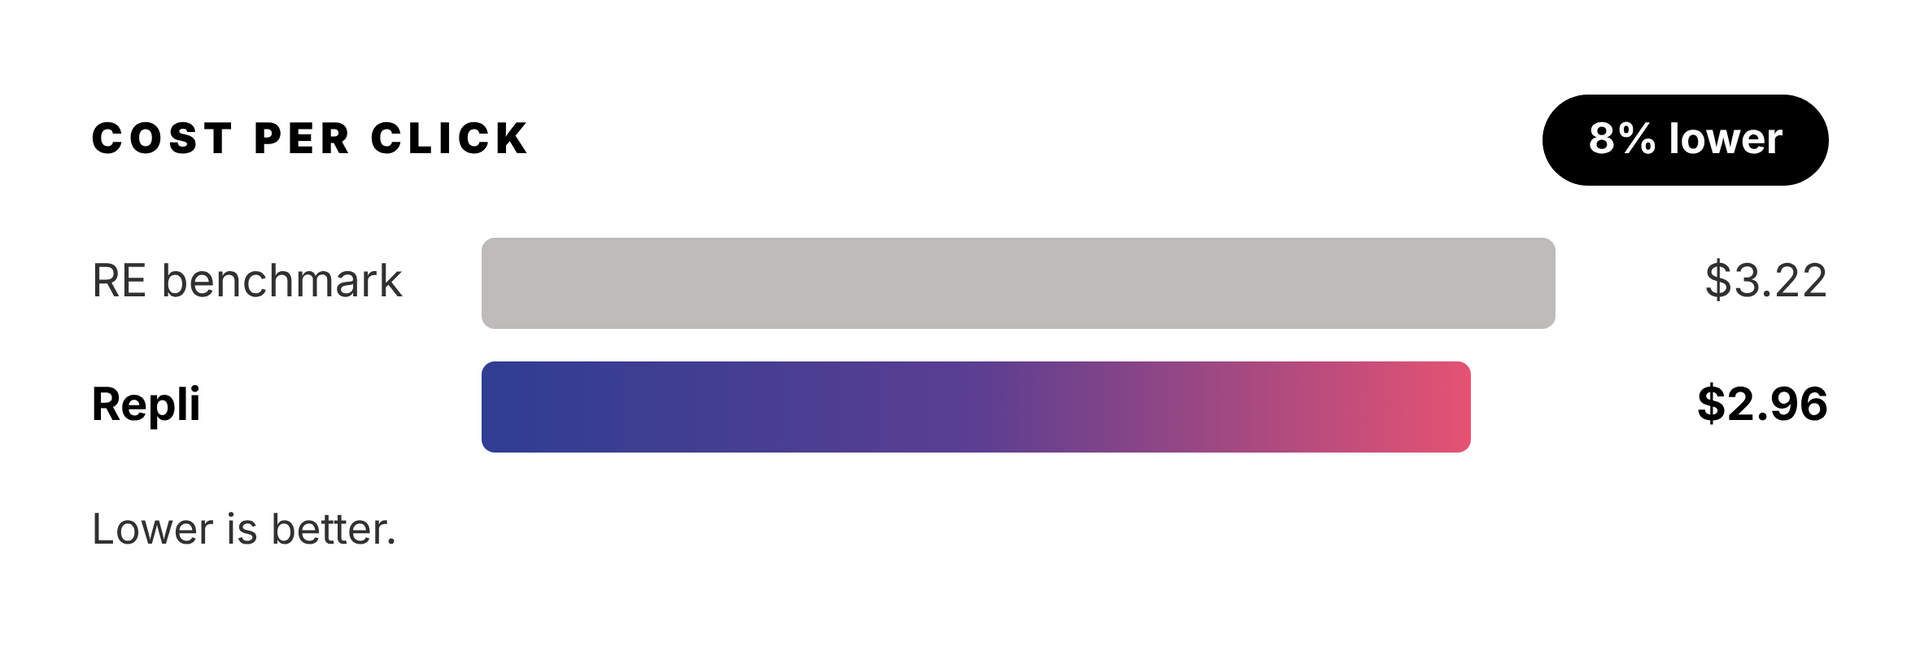
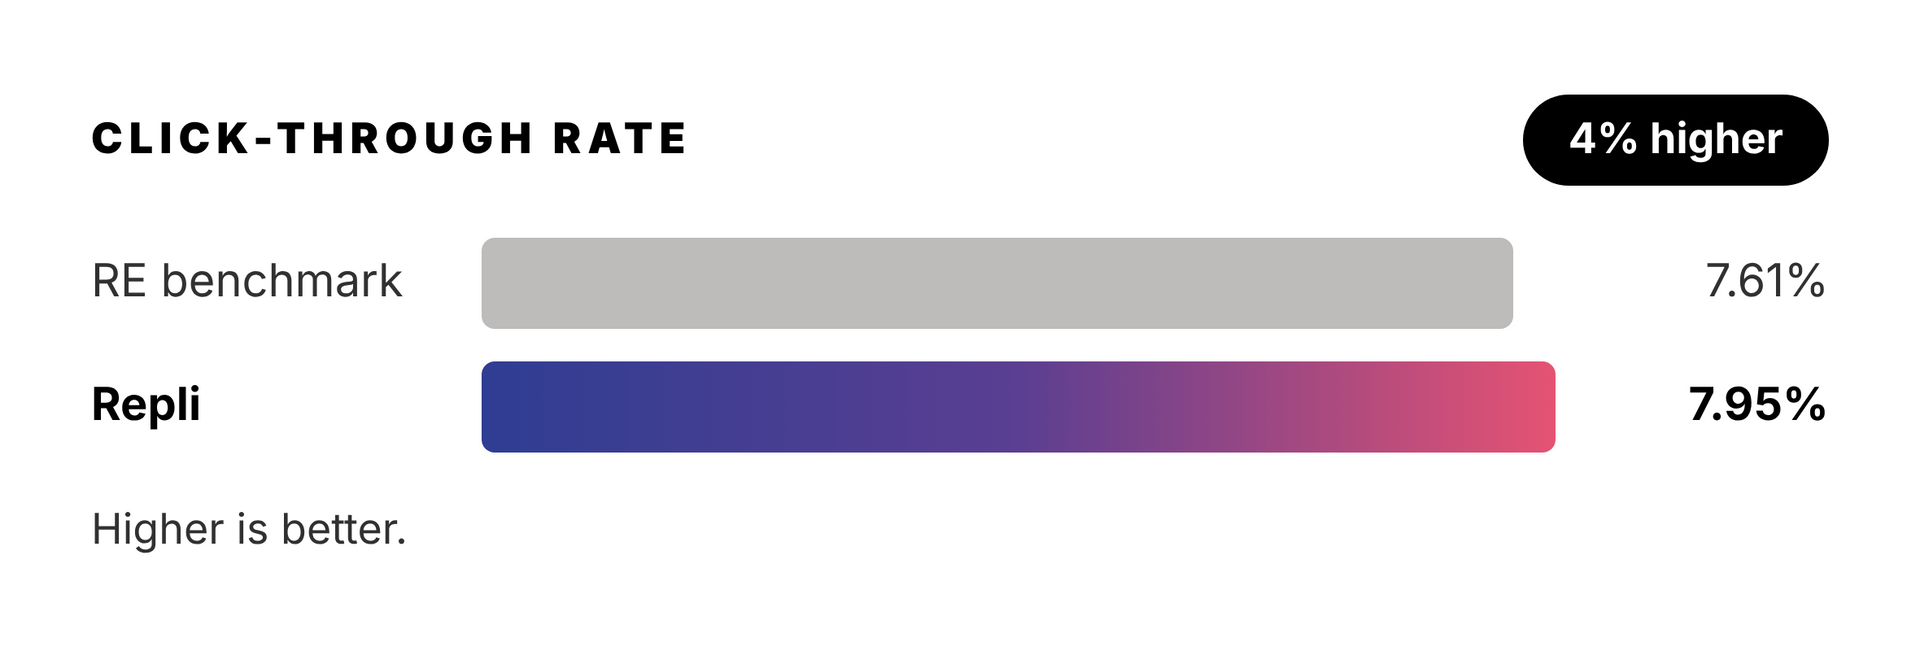
Branded vs. nonbranded.
Branded campaigns reach renters who already know the community's name. Nonbranded campaigns reach the ones who don't yet, and still beat the benchmark on cost per lead and conversion rate.
from our team.
“The Google algorithm got smarter. So did we. The benchmarks show where performance stands today. But with automation changing how search campaigns work, the next advantage comes from knowing what to automate, what to control, and what to measure beyond the click.”
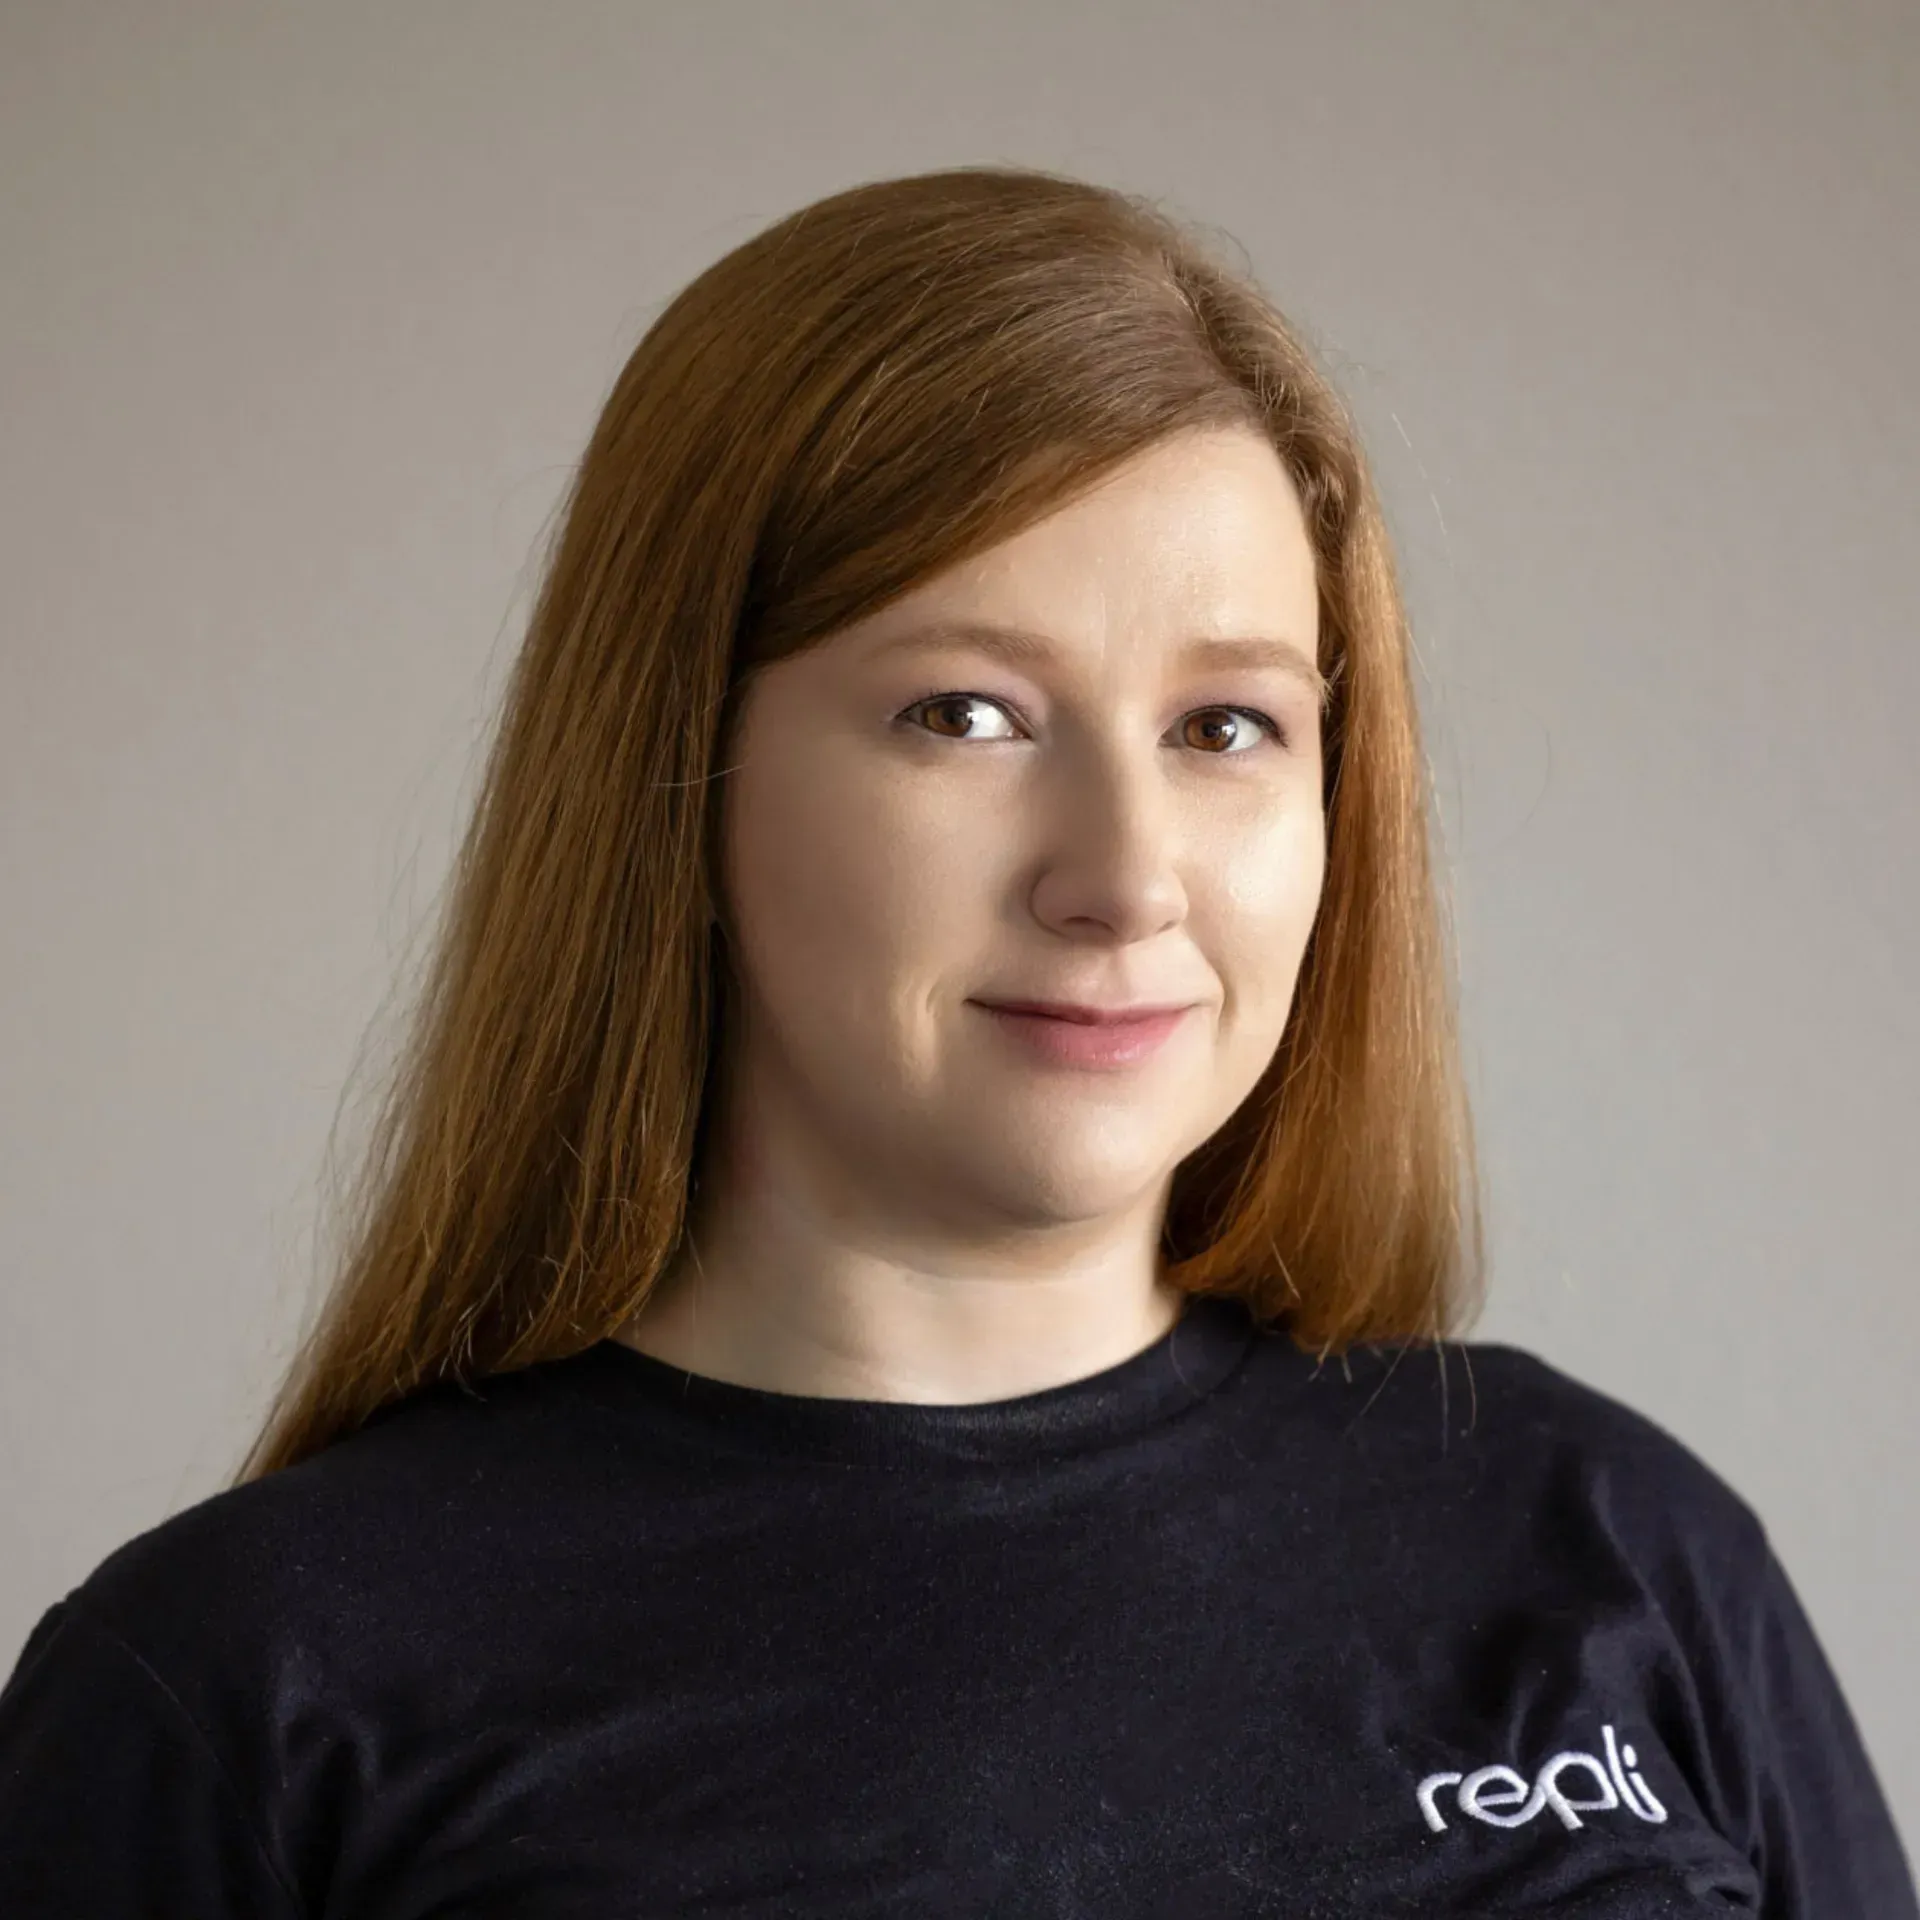
Siobhan Park
VP of Marketing & Training at Repli
Know where you stand.
Find where you can improve.
The 2026 Search Ad Benchmarks report gives you the data to evaluate your performance, identify opportunities, and make smarter decisions about your paid search strategy.
See how your campaigns stack up—and where your next competitive advantage could come from.
Benchmarks: LocaliQ, Search Advertising Benchmarks by Industry: Competitive Data & Insights for 2026 (Real Estate; 13,474 Google and Microsoft Ads campaigns, Apr 2025 – Mar 2026). Repli data: Google Ads Search campaigns, Apr 1, 2025 – Mar 31, 2026, via MultiHub. Campaigns classified by name; geo, floor plan and other campaigns without the community name count as nonbranded.
